Meteorological phenomenon 26 May 2020
 2020-05-27 (IPMA)
During 26 May 2020 afternoon, the village Fazendas de Almeirim (Ribatejo) and the surrounding area were particularly affected by a meteorological phenomenon called downburst.
This phenomenon is the occurrence of wind blowing with very strong gusts along with precipitation, sometimes in the form of hail, and by an air temperature big drop, seen in a few minutes, even in places little affected by precipitation.
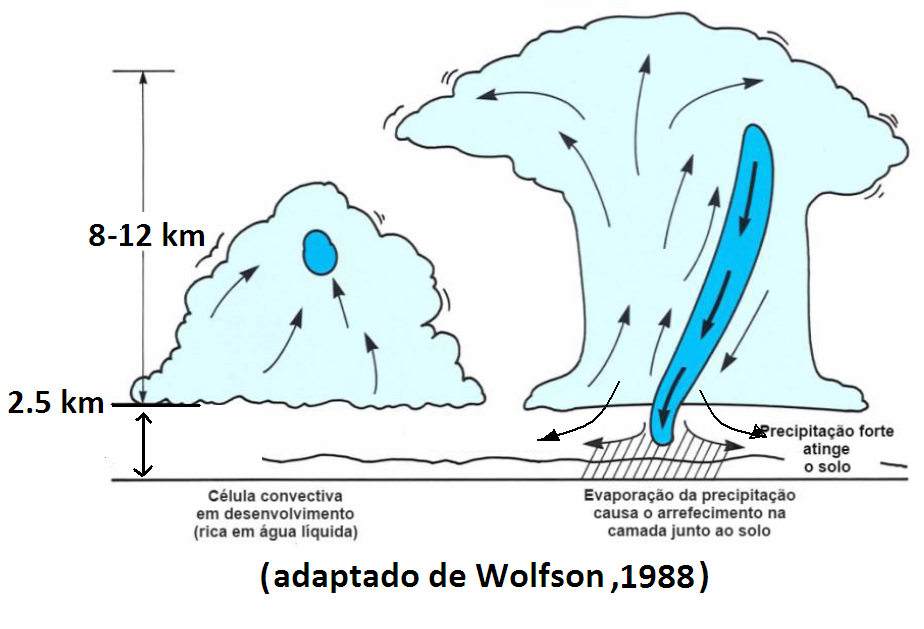
This phenomenon was boosted by an atmospheric ingredients mix wich occured during the afternoon on that region but also on other places in Ribatejo and Alto-Alentejo. The gathering of vertical development clouds occurred in an atmospheric environment defined by a high moisture content and instability. However, the altitude from which conditions existed for clouds formation was high, typically around 2500 m altitude, which led to cumuliform clouds formation but in a high base. On the other hand, the air layer between clouds ground and base was relatively dry. In this context, both the drops and the hail stones, in their precipitation path to the surface, were partially evaporated and sublimated by the relatively extensive mass of hot and dry air existed between clouds base and ground. As a result of these processes, dry air lost a lot of heat and became colder, more dense (heavier), having organized itself in very sharp downward currents. When reaching lower levels, close to the ground, the downward currents diverged and spread near the surface (see diagram in figure 1).
In this strong wind episode, the particular cloud that generated the phenomenon began to shift, with the strongest wind being felt when the divergent flow was close to the village.
Coruche's radar observed this phenomenon about 18 km away. In the observations carried out at a lower altitude, between 100 and 200 m above the ground, it was possible to follow the process of the downward current strong divergence when approaching the surface, between 18:56 (local time) and 19:26, being visible that at 19:06 it was on Fazendas de Almeirim.
Figure 2 is an animation with radar images in which the yellowish colors correspond to movements away from the radar and the greenish colors to approach movements, with Fazendas de Almeirim represented with an “X” and the radar placed at the black lines intersection.
Imagens associadas
Downburst diagram
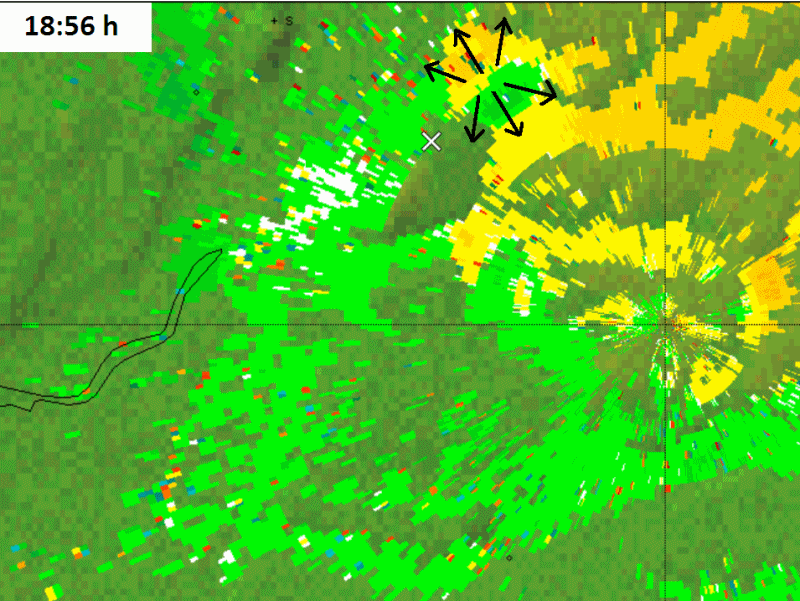
Animated Coruche Radar Image with this phenomenom

-
Lisboa:
UTC:
Copyright © Portuguese Institute for Sea and Atmosphere 2026
-
