October 2017: exceptionally warm temperatures and severe fires in Portugal
 2017-11-07 (IPMA)
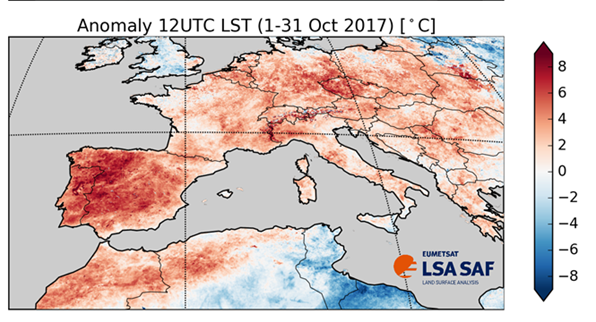
October 2017 was warmer than usual over most of Europe. Maximum (daytime) Land Surface Temperature (LST) anomalies were particularly pronounced reaching values higher than 7 °C. Minimum (night-time) LST were also warmer than usual, but with smoother anomalies. Areas with higher LST values than usual are represented in red colors.
The Fraction Vegetation Cover (FVC) over Portugal reveals thermal stress, with generalized negative anomalies. The effects of landscape fires on local vegetation are clearly visible on FVC anomaly maps. For comparison, these are shown together with burnt scars provided by the Portuguese authorities. Areas with less vegetation cover than usual are represented in red.
The left panel shows Land Surface Temperature (LST) at 00UTC (top; representative of night-time temperatures) and 12UTC (bottom; representative of daytime) over Europe. LST is estimated from thermal infrared radiances measured by the SEVIRI instrument onboard the Meteosat Second Generation (MSG) from 2004 until today. Anomalies of daytime and night-time LST in October 2017 were markedly positive over Europe. The Iberian Peninsula displays a remarkable pattern of maximum temperature, with several “hot spots” where LST is more than 7 °C above normal (Northwestern Iberia).
On the 15th of October, Northern Portugal and Galicia were stricken by severe fire events, where large areas of vegetation were consumed. The right panel of the figure shows the decrease of Fraction Vegetation Cover (FVC) for the first and the third decades of October. In both figures, a smooth negative anomaly of vegetation is generally consistent with the extreme LST values observed. However, a large area of FVC anomalies stronger than -0.2 in the first 10 days of October is evident and corresponds to the burnt areas of previous months (see burnt scar in bottom right panel), whereas in the last 10 days the destruction of vegetation due to the 15th fire becomes evident.
Imagens associadas
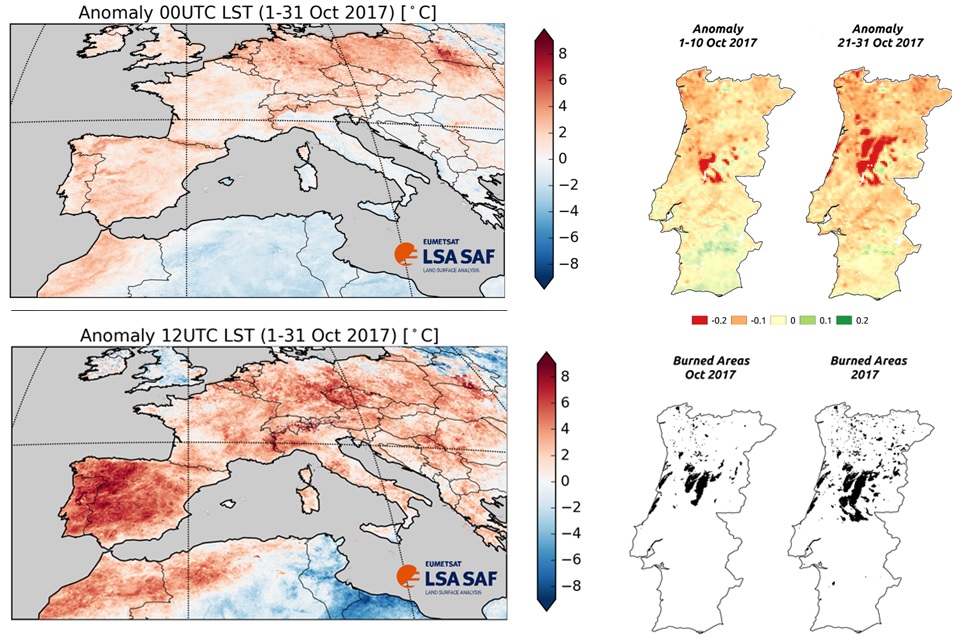
(Top, left) Temperature anomaly at 00UTC. LSA-SAF data. (Low, left) Temperature anomaly at 12UTC. Data from the LSA-SAF (Top, right) Anomaly of Fraction Vegetation Cover in the first ten days of October and in the last ten days of October. LSA-SAF data (Low, right) Areas burned in October and in total for the year 2017. ICNF data.

-
Lisboa:
UTC:
Copyright © Portuguese Institute for Sea and Atmosphere 2026
-
