Instituto Portugues do Mar e Atmosfera - Homepage

  • Who we are | 
  • Where we are | 
  • Scientific Council | 
  • Research | 
  • eLibrary | 
  • ipma encyclopedia  | 
  • Contacts | 
  • Português
  • Weather
    • Weather forecast
    • 10 days and hourly forecast
    • Weather Warnings
    • Meteorological charts
    • Vertical profile
    • Satellite observations
    • Radar
    • Lightning
    • Solar Radiation
    • Online weather stations
    • World forecast
    • Tropical cyclones forecast
    • Report a meteorological phenomenon?
  • Seismic
    • Seismic maps
    • Shakemap
    • Felt an earthquake?
    • Moment Tensor
    • Networks
    • Bulletins
    • Projects
  • Sea
    • Beaches and ports
    • Marine forecast
    • Significant wave height
    • Sea peak period
    • Surface current
    • Sea surface temperature
    • Sea surface height
  • Climate
    • Climate Monitoring
    • Climate Normals
    • Daily monitoring
    • Long data series
    • Monthly monitoring
    • Drought
    • Greenhouse gases
    • Climate Extremes
    • Climate web portal
    • Climate Services
  • Bivalves
    • Bivalves - Situation point
    • Legislation and Documents
    • Production areas
    • Biotoxins
    • Phytoplankton
    • Contaminants Metals
    • Microbiology
    • Bivalves - historical
  • Fisheries
    • Disclosure
    • Projects
    • Fish management
    • ICES
  • Aeronautic
    • TAF and METAR
    • Self Briefing
    • Know more
  • Agriculture
    • Soil Moist Index
    • Vegetation Health Index (VHI)
    • Fraction of Absorbed Radiation (FAPAR)
    • More information
    • Agroclimatic platform
  • Health
    • Ultra-violet index
    • Ozone
    • Pollen
    • Air temperature
  • Vessels
    • Framework
    • RV Mário Ruivo
    • RV Diplodus
    • Maris
    • Recife II
    • Cardium
  • Space
    • MSG satellite
  • Rural Fires
    • Mainland Rural Fire Danger
    • Madeira Rural Fire Danger
    • Reports Rural Fire Danger

News

  • 1st Meeting GOOS/EOOS

    EOOS logo European Ocean Observing System
    Mon May 05 09:00:00 UTC 2025
  • Diplodus in Total Requalification

    Total Requalification of IPMA Vessel Total Requalification of IPMA Vessel
    Fri May 02 09:00:00 UTC 2025
  • Iberian Symposium SIMERPE 3

    SIMERPE 3 Symposium on the Evaluation of Fisheries Resources
    Fri May 02 09:00:00 UTC 2025
  • More news
IPMA>Climate>Gases atmosfera com efeito estufa

Carbon Dioxide

//www.esrl.noaa.gov/gmd/webdata/ccgg/trends/mlo_co2_hour.png

Atmospheric Carbon Dioxid monthly, Mauna Loa, Hawaii

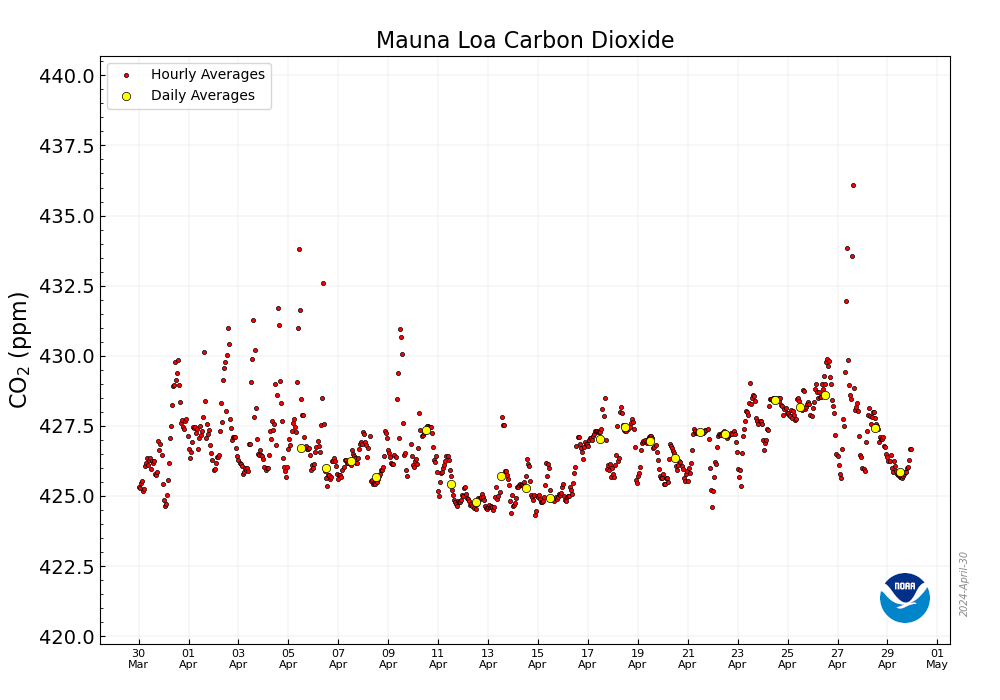
The CO2 data (red curve), measured in Mauna Loa as the mole fraction in dry air, constitutes the largest register of direct CO2 measurements in the atmosphere. They were initiated by C. David Keeling of the Scripps Institution of Oceanography in March 1958 at a facility of the National Oceanic and Atmospheric Administration [Keeling, 1976].

The month graph, updated daily, shows as individual points daily and hourly mean CO2 for the last 31 days. Daily average CO2 values are computed from selected hourly values that satisfy 'background' conditions, i.e. stability and persistence of CO2 concentrations (read below for more information). That means the daily averages shown on the plot are likely computed from a subset of the hourly averages. It also is possible that no daily average can be computed even though hourly averages exist, because all of the hourly averages for a day do not satisfy the background conditions. These daily average values may also change as a result of the selection process as additional data become available. The daily means are based on hours during which CO2 was likely representative of “background” conditions, defined as times when the measurement is representative of air at mid-altitudes over the Pacific Ocean.

The year graph is updated weekly, shows as individual points daily mean CO2 up to and including the week (Sunday through Saturday) previous to today. The daily means are based on hours during which CO2 was likely representative of “background” conditions, defined as times when the measurement is representative of air at mid-altitudes over the Pacific Ocean.

The 5 year graph shows recent monthly mean carbon dioxide measured at Mauna Loa Observatory, Hawaii.

GHG Concentration Terceira Island

  • Série completa, CO, CO2, CH4

CO2 Concentration - Mauna Loa, Hawaii

  • Last Month
  • Last year
  • Last five years
  • Complete serie

Monthly mean atmospheric carbon dioxide at Mauna Loa Observatory, Hawaii  The carbon dioxide data (red curve), measured as the mole fraction in dry air, on Mauna Loa constitute the longest record of direct measurements of CO2 in the atmosphere. They were started by C. David Keeling of the Scripps Institution of Oceanography in March of 1958 at a facility of the National Oceanic and Atmospheric Administration [Keeling, 1976].

NOAA started its own CO2 measurements in May of 1974, and they have run in parallel with those made by Scripps since then [Thoning, 1989]. The black curve represents the seasonally corrected data.  Data are reported as a dry mole fraction defined as the number of molecules of carbon dioxide divided by the number of molecules of dry air multiplied by one million (ppm).

Visit NOAA Site »

IPMA NOAA
 
 
  • Media

    • News
    • Communiqué
    • Lectures / workshops
    • YouTube
    • IPMA on Educast
  • Social network

    • Facebook
    • Facebook - Azores
    • Twitter
    • Instagram
  • Services

    • Products and services
    • RSS
    • Apps Android
    • Apps Apple
    • PDA
  • Information

    • Contact
    • Useful links
    • Research scholarship
    • EEAGrants projects
    • ECMWF
  • About site

    • Accessibility
    • Legal warnings
    • Site Map
  • Web projects

    • Observar
    • Subscriptions
    • Survey
    • E-learning
    • Shakemap
 
  • Apcer - A marca da Certificação
  • Lisboa:
        UTC:

    Copyright © Portuguese Institute for Sea and Atmosphere 2025
  • Ministério da Economia Ministério Agricultura e Pescas